Various countries in the grip of COVID-19 pandemic have resorted to lockdown as one of the main strategies to delay the spread of SARS-CoV-2 (the virus that causes COVID-19). For India, which had one of the most stringent lockdowns in the world, it did not help in flattening the curve, and the number of daily new cases has continued to rise. However, the lockdown has caused apparent improvements in few environmental factors like air, water, and noise pollution.
Air pollution is of particular concern as it can exacerbate the risk of COVID-19 as well as increase the severity of the disease in infected individuals. Particulate matter in the air can aid the spread of SARS-CoV-2. Chennai, the capital of one of the most industrialised states of India, has several factors like vehicular emissions, garbage burning, localised industrial pollution, and dust pollution responsible for its poor air quality. While there was large reduction in the number of vehicles during the lockdown, activities such as burning of coal in the power plants located in the northern part of the city and dumping of waste in the Perungudi and Kodungaiyur dumpyards continued to emit pollutants.
The source of data and approach for this study is as described in our earlier study of air pollution during the Phase 1 of lockdown in Chennai. In this analysis, we will be looking at data from Phase 1 to Phase 4 of the lockdown, from the 24th of March to May 31 (69 days). For PM 2.5, SO2 and NO2, 24 hour average data was collected from March 24 to May 31, for the years 2017, 2018, 2019 and 2020. For CO and ozone, eight-hour average data was collected for the same dates and years mentioned above.
I have considered a few limitations while analysing the data from the CAMS equipment maintained by CPCB and TNPCB. Concern for regular calibration and maintenance of equipment exists as there are many days with no data recorded for the parameters considered in this study. Regular calibration and equipment maintenance is a particular challenge during lockdown because of restrictions in movement of personnel.
During the lockdown period from March 24 to May 31, PM 2.5 levels were lower than during the same duration in 2017, 2018 and 2019 by 4, 2.5, and 2.4 fold respectively. The number of days on which the daily average PM 2.5 levels was less than 2 fold or more compared to the same period in 2017, 2018, and 2019 was 57, 37, and 36 days out of 69, respectively. On 52 days out of 69 during lockdown, daily average PM 2.5 levels from the four CAMS were within the World Health Organization (WHO) prescribed standard of 25 µg/m3, a significant improvement over 2017, 2018, and 2019 levels during the same period (Figure 1). Data from all four CAMS stations show that PM 2.5 levels were the lowest in all these locations as compared to previous three years. This clearly indicates that the lockdown period was the best in the last four years with respect to particulate matter pollution reduction. Dust particles, fine particulate matter from unpaved roads, construction sites, fuel combustion and fires, and complex chemical reactions taking place in the atmosphere between oxides of nitrogen and sulphur that are emitted from sources like power plants, automobiles, and industries - all contribute to formation of PM 2.5. With reduced vehicular traffic and halt in construction activities, they are the prime determinants of the reduction in PM 2.5 levels seen during the lockdown period.
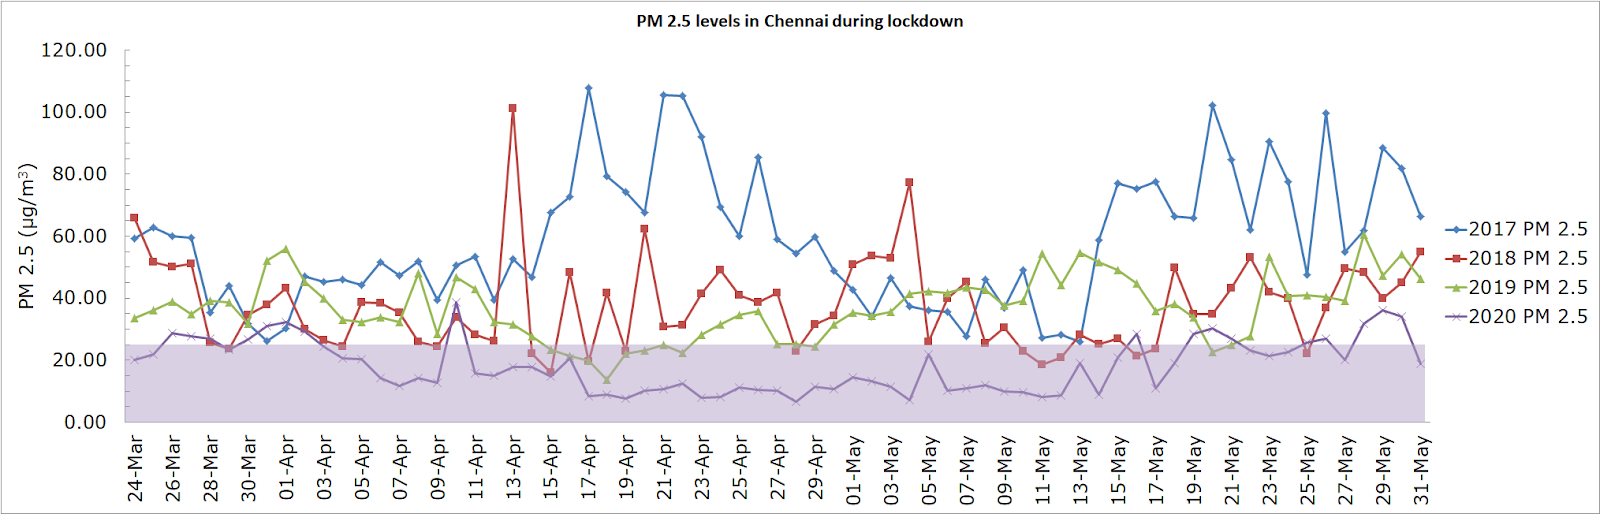
Figure 1: Reduction in PM 2.5 levels during lockdown as compared to the last 3 years
Values within the shaded area represent the values that are below the WHO standard of 25 µg/m3
SO2 emissions are primarily due to coal burning and because power plants in Chennai’s north have continued to operate, the levels of SO2 during lockdown period are similar to that in the last three years. NO2 levels during lockdown period were 2.2, 4.1 and 1.9 fold lower as compared to that during the same period in 2017, 2018, and 2019, respectively. The days on which the daily average NO2 level was less than 2 fold or more compared to the same period in 2017, 2018, and 2019 was 34, 50, and 21 days out of 69, respectively. NO2 levels in 2020 during lockdown are lowest as compared to the last three years (figure 2). NO2 in the atmosphere is a result of emissions from two-wheelers, cars, buses, trucks, power plants and some off road equipment like diesel generator sets. Reduction in vehicular traffic during lockdown period is the single biggest factor for the drop in NO2 levels in Chennai.
For CO and ozone, data is available only for the years 2019 and 2020, and there is no significant difference in their levels. CO is formed from incomplete fuel combustion (from vehicular emissions and other sources), while ozone is a secondary pollutant formed in the atmosphere from chemical reactions between oxides of nitrogen and volatile organic compounds (VOCs) in the presence of sunlight. In our previous article analysing phase 1 lockdown period, CO levels in 2020 were lower owing to reduced vehicular movement, but that is not the case here, while ozone levels have remained the same in phase 1 lockdown as well. More data is needed to critically analyse the factors responsible for CO and ozone emissions in Chennai, which unfortunately is unavailable at the moment.
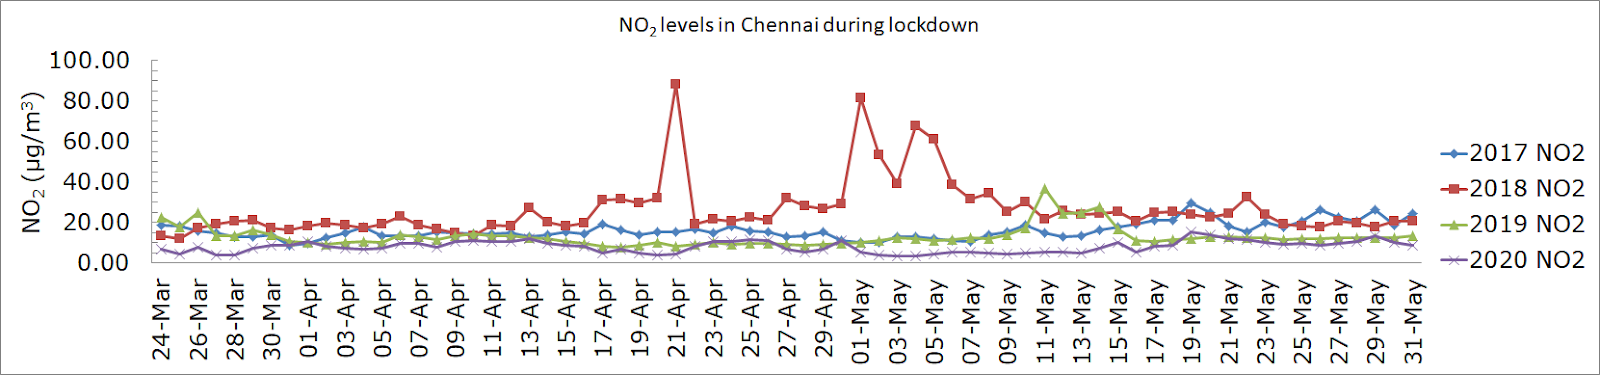
Figure 2: Reduction in NO2 levels during lockdown as compared to the last 3 years.
The entire lockdown period has shown that improvement in air quality is possible with strict enforcement of reduced industrial and human activities. The onus is on all the stakeholders including, but not limited to the government, the citizens and the corporate class to adopt measures and actions from the lockdown and make it a part of everyday urban life. The decongestion of city’s traffic choke points and the subsequent reduction of particulate matter pollution during lockdown have shown us that we do not need new flyovers and roads. What has worked is a work-from-home policy for the very large workforce of the city which has taken off single user cars and two wheelers from the city roads, thus lowering pollution (PM 2.5 and NO2) and decongesting traffic. Work-from-home for sectors where it is possible and a hybrid system of work-from-home combined with on-site work for other sectors can significantly reduce air pollution from vehicular emissions, reduce road accidents and will free up space for pedestrians and cyclists. Staggered timing for educational institutes, government, and private offices and industries will further ease the vehicular burden on city’s roads and reduce vehicular pollution.
Air pollution is a known health and environmental hazard, and this lockdown period has provided unequivocal evidence of steps for air pollution mitigation. While reduced vehicular emissions help, it is just a spoke in the wheel and we need more sustained focus on sectors that continue to operate and emit air pollutants during lockdown. For Chennai, it is the power plants to the city’s North, garbage burning, and the dumpyards in Kodungaiyur and Perungudi that prevent further improvement in Chennai’s air quality. Advocacy, outreach, and active public participation to pressurise the government to phase out coal will go a long way in reducing the clouds of SO2 over Chennai’s skyline. Individual actions and government policies are required for promotion of sustainable waste management practices to reduce the waste directed to the dumpyards and to prevent garbage burning. There are significant social, environmental, economic, and health costs associated if we let the lessons for air pollution mitigation slip under the radar. It will be a fallacy to look for other technocratic solutions like smog towers, more roads, and flyovers and ignore the simple solutions that came to light during this lockdown.