A 2011 report of the Committee on slum Statistics/Census pointed out the lack of information and paucity of data in informal settlements. This poses a problem to local authorities because they need high-quality data to formulate effective public policy and plan public service provision. The Transparent Cities Network (TCN) bridges this gap by creating maps, data, and research about neglected civic issues in partnership with NGOs, residents, and governments. This extends itself to our “Enabling transformation through information in Ranchi” project, where we are working with Mahila Sewa Housing Trust (MHT) to create better information about the poor through the process of slum mapping. These maps will be used to improve public infrastructure in informal areas through community engagement. This brief piece intends to elaborate on the different methodologies used in mapping Ranchi’s slums. We used a mix of satellite imagery, hand-drawn maps and predigitised images for mapping.
Using hand-drawn maps:
Creating our own maps and data helps communities overcome the lack of official data and maps. Our slum mapping methodology initially involved the use of hand-drawn maps and recce data for slum digitisation. This was to ensure that the technology required was kept to a minimum during collection. The maps included buildings, roads, public infrastructure and amenities, and also the dimensions of each house and road. A GPS device was used to obtain coordinates of entities on the map. They were then digitised using Quantum Geographical Information Systems (QGIS), a mapping application.
Even though hand-drawn maps and GPS coordinates were easy to create and obtain, their conversion into clear and accurate slum maps posed a challenge. This is because it is difficult to map scale on hand-drawn maps. Free-hand drawn maps do not truly represent the actual size of the area. Also, stringing segmented paper maps together to depict the layout of slums was a challenge. The efficacy of GPS coordinates comes into play here. Poor network connectivity on certain days and in certain areas resulted in inaccurate coordinates. There were also some challenges in standardising the maps drawn by different people because each had their own variations in styles of mapping and symbology that were difficult to decipher.
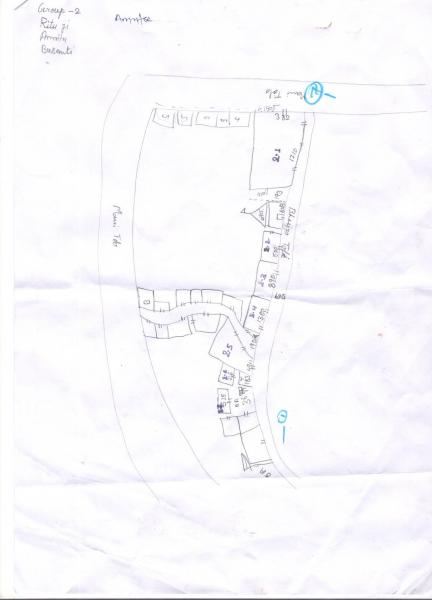
Hand-drawn maps of “Road 7” and the first part of Bhuiyan Toli.
The scale of these houses was determined by taking measurements of its surface area.
The adoption of Satellite imagery:
Slum mapping using hand-drawn maps was improved with the addition of satellite imagery. Our team started to draw houses over satellite imagery, to provide exact locations of each house. This was complemented by hand-drawn maps and recce data, to help pinpoint the exact location of houses. Combining hand-drawn maps with satellite images helped overcome tree cover and low-quality imagery which would otherwise result in missing houses and amenities.
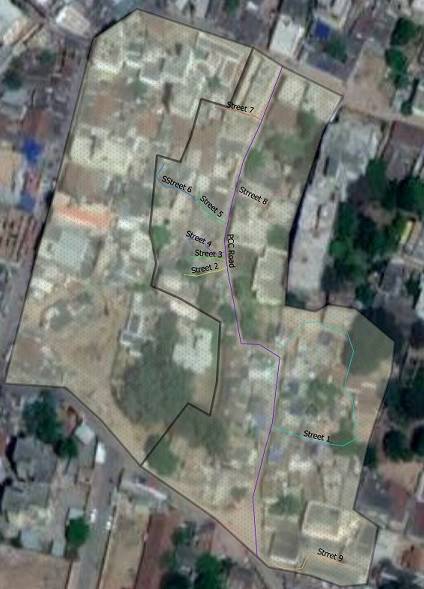
Recce data of Bhuiyan Toli. The streets and boundary were to be fixed
after ground truthing. This was used as the basis for predigitisation.
Predigitising maps for ground truthing:
We further evolved the process by digitising the roads and buildings based off the satellite imagery that would be used for ground truthing on field. This further reduced the need for hand-drawn maps, and so mitigated the challenges involved in their digitisation.
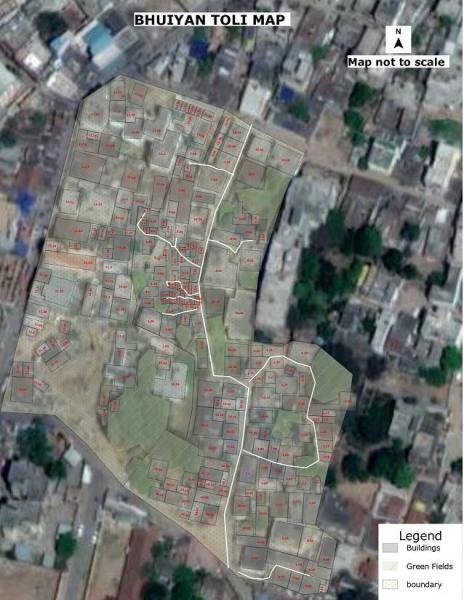
The rough predigitised map for ground truthing. Note that houses have not been created under green cover, and have roughly been made off building blueprints.
The rough version of the map was vastly different from the final version because of poor quality satellite imagery.
Ground truthing helped us verify the ground realities and ensure that they are reflected on the map. Digitised houses that did not exist on the ground were excluded, and other entities were either added or their shapes edited. This process made digitisation easier, as the rough building footprints were already created beforehand. Our team finished mapping the same amount of slums in 50% less time. However, this increases the QGIS skills required to prepare the maps and hence smaller organisations or communities may find it difficult to recreate the same.
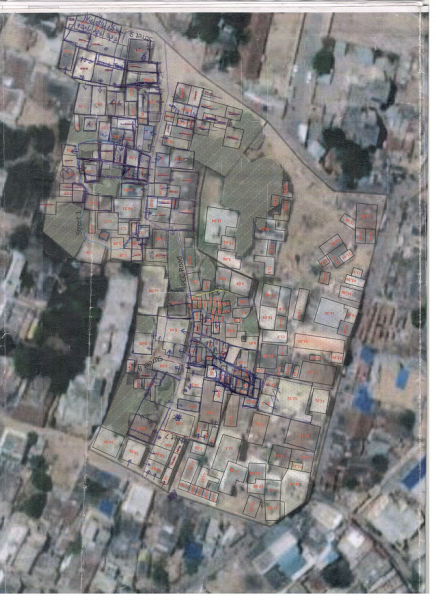
This is the rough digitised map after ground truthing. Houses that did not match were cancelled out and redrawn.
Some areas that were too small to edit were redrawn on a hand-drawn map.
Even though this format made mapping easier, hand-drawn maps still played an important role during ground truthing. While mapping houses in Bhuiyan Toli, a slum in Ranchi, we realised that there was not enough space to draw multiple houses on the map. We drew hand-drawn maps to represent the section on a bigger scale and size. As a result, it made sense for us to pick and choose our methodology depending on the context and need. Further nuances were added to the map during surveys. Houses, after ground truthing, were verified by the survey team. Apart from this, the survey team collected data on land and house ownership, sewerage, sanitation, and water.
On the whole, the collection and aggregation of this data was only possible with a flexible mapping methodology that involved the use of ICT and participatory mapping methodologies. This is because different maps and methodologies are accurate in different contexts. A fixed methodology of mapping would have resulted in a longer and more tenuous mapping process marred with inaccuracies and errors. This brings about the need for better education and advocacy for mixed mapping methods.
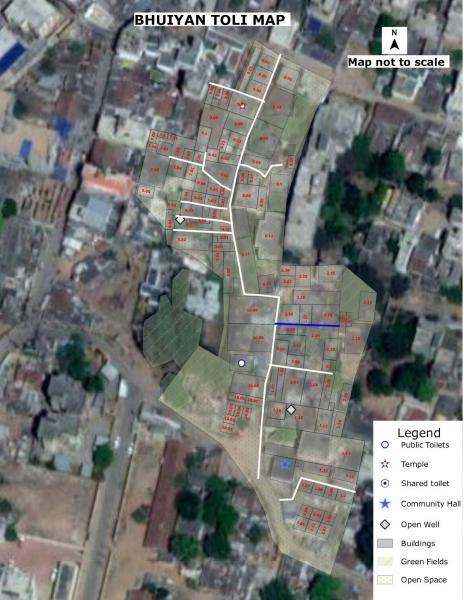
The final map after ground truthing. The hand-drawn map above depicts houses 9.01 to 9.07.