Power Supply Quality is the benchmark of an ideal power supply, available at all times in the right quality. The two major attributes of power supply systems include (i) reliability which depends on uninterrupted supply of electricity and (ii) quality which depends on voltage and frequency of electricity supply.
The Tamil Nadu Context: Section 3, TNERC’s Distribution Standards of Performance, defines quality of power supply as “providing uninterrupted, reliable electric supply at stipulated voltage and frequency, which will be the end result of its planning, designing of network, operation and service management to ensure stability in supply and prompt compliance of consumers’ complaints on metering and billing.”
This report draws from Electricity Supply Monitoring Initiative (ESMI), a program implemented by Prayas (Energy Group) to improve transparency and provide evidence-based feedback about the quality of electricity supply. Prayas, in partnership with CAG, launched this initiative in Tamil Nadu. Through ESMI, specially designed, mobile data-enabled monitoring devices, providing data on interruptions and voltage fluctuations, have been deployed at select residential locations in Tamil Nadu. Further, electricity supply data from each of the locations have been recorded and published, since May 2018.
I. APPROACH
-
Electricity supply data available between May 2018 and December 2018 from a total of 12 residential locations across the districts below have been studied:
(a) Cuddalore - Combination of gram panchayats and municipal areas;
(b) Thiruvallur - Municipal area; and
(c) Chennai - The state capital
-
Power supply quality, based on district-level averages of ESMI data, have been analysed and compared with each other.
II. COMPARATIVE ANALYSIS
II. A. On Reliability: The number of interruptions in power supply and the duration of power cuts help estimate the reliability of power supply. For each of the districts, data on interruptions in electricity supply were studied and the following were identified for a period of eight months, between May ’18 and December ’18.
(i) Number of Interruptions1: It can be observed that on an average Chennai experienced the least number of interruptions in power supply; whereas, the district of Cuddalore experienced most number of interruptions.


-
Thiruvallur experienced nearly 48.5% more interruptions than Chennai;
-
Cuddalore experienced more than twice as many interruptions as Chennai; and
-
All three districts experienced more short interruptions than long interruptions.
Number of Interruptions: The below graphs represent the average number of short and long interruptions faced in power supply across the three districts for the 8 month study period.
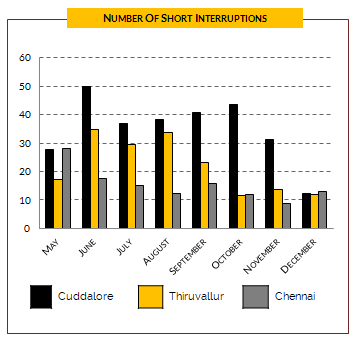
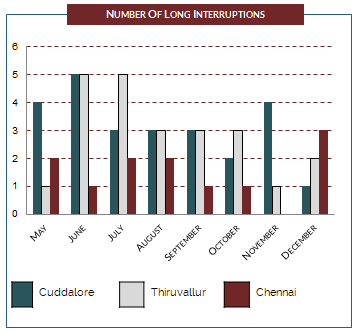
It can be observed that:
-
On an average, Cuddalore and Thiruvallur experienced the most number of interruptions (short and long) in the month of June.
-
On an average, Chennai experienced the most number of short interruptions in the month of May; and long interruptions in the month of December
-
Cuddalore faced a steady increase in the number of short interruptions from June - October ’18;
-
Thiruvallur faced a steady decrease in the number of long interruptions from June - November ’18
(ii) Hours of power cuts/no supply: District-level averages of hours of power cuts experienced in each of the three districts over the eight-month period were observed. The results indicate that, on an average, Cuddalore experienced most hours of power cuts as against Thiruvallur and Chennai.

Hours of power cuts between May – December (district-level averages):
-
Cuddalore – 127 hrs;
-
Thiruvallur – 99 hrs; and
-
Chennai – 62 hrs
Peak months and hours of power cuts (district averages) in those months:
-
Cuddalore – June ’18, 23 hrs
-
Thiruvallur– June ’18 & July ’18, 22 hrs each
-
Chennai – December’18, 13 hrs
II. B. On Quality: Among other attributes, a lower percentage of voltage fluctuation indicates better quality2 of power supply. Therefore, average voltage fluctuations in each of the districts have been studied to identify periods of (i) normal voltage and (ii) voltage fluctuations.

-
Electricity supply in Chennai has the lowest percentage of voltage fluctuations;
-
Electricity supply in Thiruvallur has the highest percentage of voltage fluctuations; and
-
Chennai and Cuddalore have stable voltage of power as against Thiruvallur.
III. SUMMARY OF FINDINGS
-
Chennai, the state capital performs better than Cuddalore and Thiruvallur, both in terms of power reliability and quality.
-
Electricity supply in Thiruvallur is more reliable than Cuddalore with comparatively lesser number of interruptions.
-
Cuddalore has a better quality of power supply than Thiruvallur with a lower percentage of voltage fluctuations.
In recent times, Tamil Nadu can be seen taking several measures to improve power supply quality. But, these measures largely focus on the state’s capital, Chennai. Case in point being the recent Tamil Nadu Energy Policy Note 2018-2019, which outlines infrastructure projects proposed to meet specific demand targets for Chennai. Such focus at the planning level explains why power supply quality in Chennai is visibly better than other districts of Tamil Nadu.
IV. RECOMMENDATIONS
There is a strong need to improve power supply quality in all districts of Tamil Nadu with the same level of planning and focus currently devoted to Chennai. Further, as the first step towards improving power supply quality for all, it is crucial to build a transparent and reliable database for power supply across all districts. This would in turn (i) create awareness among consumers about the importance of power supply quality; and (ii) ensure increased accountability of distribution companies in supplying quality power for all.
*Data mining and analysis by Balaji M.K.
Footnotes:
1 Based on ESMI data: (i) Interruptions in electricity supply that lasted less than an hour have been considered as short interruptions. (ii) Interruptions in electricity supply that lasted longer than an hour have been considered as long interruptions.
2 Based on regulations, ESMI considers ‘normal’ voltage range as 205 V to 270 V. Any deviation from the normal voltage range is considered as voltage fluctuation.