Human activities, that are a part of the evolution of urbanization and industrial development, have led to major pollution-related issues. These include the ecological impact of residential, industrial, and other developmental projects, such as power plants, mining, etc., that affect the environment and human living conditions. Lack of planning and a basic understanding of the ecology affects its balance leading to pollution of water, air, soil, and other natural resources.
To address the above, a lucid-cum-quantifiable method, called the Comprehensive Environmental Pollution Index (CEPI) method, has been formulated in order to measure, understand, and take action on the polluters. CEPI bridges the perceptive gap between experts, public, and government departments by simplifying the complexity of environmental issues. It aims at categorising critically polluted industrial areas based on scientific criteria, so as to ascertain various dimensions of pollution. This is a combined framework used to evaluate the impacts caused by industrial clusters on the nearby environment, as a numerical value.
CEPI was first developed by Central Pollution Control Board in collaboration with IIT Delhi in December 2009 and was later revised as CEPI 2016 by abolishing few subjective factorials. The evaluated CEPI score reflects the environmental quality of the identified industrial clusters and is a yardstick to assess the progress achieved in the implementation of pollution mitigation measures.
Methodology:
Framework:
Step 1: The datum is provided based on the ground information available and follows the order:
Source ---» Pathway ---» Receptor
Step 2: Environmental indicators assessing the status of land, soil, water, and air to be investigated with the available spatial and temporal information.
Step 3: Skilful consultation from local stakeholders, experts, and policymakers.
Here, step 1 uses the datum from Central Pollution Control Board (CPCB) and State Pollution Control Board (SPCB); step 2 and 3 use information from various environmental investigations around the industrial cluster.
Scoring:
Separate indices or sub-indices (EPI) are scored separately for air, water, and land for the same industrial cluster, using which a comprehensive index (CEPI) is formulated. The sub-indices are calculated with variables A, B, C, and D, named after pollutant (source), pathway, receptor, and additional high-risk elements - i.e., availability of pollution control equipments such as Effluent Treatment Plant, Air Pollution Control Devices in each industry in that industrial area, respectively.
Sub Index (EPI) = A + B + C + D
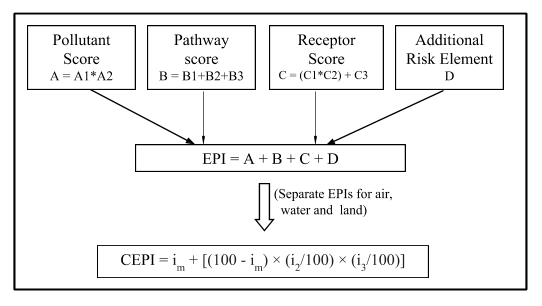
CEPI Calculation chart
Where, im - maximum sub index; i2 and i3 – other two sub indices
In the above figure, sub-variables A1, A2, B1, B2, B3, C1, C2, and C3 represent different criteria of the variables A, B, and C respectively. Each criterion is assigned a value which directly or indirectly depends on the information available with the CPCB/SPCB. Value for sub-variable A1 is assigned depending on the nature and presence of toxins (such as Volatile Organic Compounds, carcinogens PM2.5, PM10, etc.,), and value for A2 is assigned based on the scale of industry (such as large, moderate and limited). Parameters such as Exceedance factor and SNLF factor for the identified pollutants are to be formulated for obtaining the values for sub-variables of B. Value of C and its sub-variables depends on the number of health impact cases recorded in two consecutive years. A penalty score is to be added with the above depending on the combination of pollutants in that area. After this, EPI can be formulated for air, land, and soil separately. CEPI can be calculated by applying the highest EPI value of the three in im and the remaining two EPIs in i2 and i3. If the final CEPI score is 70 or above, the region is critically polluted and if the score is between 70 - 60, the area is considered to be severely polluted region.
By knowing the value of CEPI, the vulnerability of the industrial area can be easily studied.
Why CEPI 2016?
After the application of the 2009 version, it was observed that some factors such as population affected by pollution or the health impacts due to pollution could not be objectified and thus brought in difficulties in calculating the index. This was a problem since it affected the reliability of the index, preparation of which was time-consuming and required funds.
The revised CEPI 2016 takes into consideration the subjective datum. Weightage given to each variable (A, B, C, and D) has also been altered. For example, the previous version had only 20 as a score for Pathway (B); in the revised version, it was increased to 50, as this part of the index provides more scope for quantification.
The revised CEPI mainly concentrates on a few aspects like improved information available to the public about identified polluting sources, including information on compliance/availability of pollution control measures and major health impact caused by the industrial cluster. The critically polluting industry thus identified will be permitted for any process change (expansion of production capacity/change of product or raw material, etc.,) which results in less pollution. Accompanying these decisions, proper supervision and monitoring facilities should be provided by the respective SPCBs.
Conclusion:
CEPI provides comprehensive information on the extent and types of pollution caused by a particular industrial cluster, which then can be used to identify appropriate pollution mitigation measures. The source-pathway-receptor approach takes into account the complete geography that is affected by a polluting industry. As this index is a quantitative approach to understanding certain qualitative impacts caused by the polluting industry, monitoring authorities should monitor pollution and maintain proper records. Though the scope of the revised index, in terms of quantification, has been increased, CEPI will not represent reality unless proper data collection along with continuous data flow is ensured. With increasing industrial activity in India, Cumulative Impact Assessment is gaining attention. CEPI is an effective tool to concisely represent the wide and diversified effects of pollution using numbers.
Add new comment