Maps have historically been used in the field of agriculture, mining, engineering and research for providing its users with a snapshot of valuable information about a place and its features. While maps serve as a useful tool for planning and decision-making, the control over the making of maps encourages exclusion of citizens’ participation in the process of planning and delivery of critical public services. In view of the essential role played by maps, the TCN project in Ranchi studies the distribution of basic services pertaining to water and sanitation. To begin with, we set out to find existing maps and data of the city to understand some of the existing public services rendered to the 15 slums being mapped with the help of communities.
After doing an extensive internet search, we had come to learn that a series of maps of the city were prepared under various government-funded projects. I spent some time studying the Ranchi Utilities Information System (RUIS) to understand the utility services available in the city. I hoped to glean information on the nature of public services being rendered by the Ranchi Municipal Corporation (RMC) to some of the slums that we were mapping.
The report was prepared between 2006 to 2009 by Jharkhand Satellite Applications Centre (JSAC) in tandem with the RMC. Surveys were conducted and ward-wise GIS mapping of land use was carried out. Types of buildings and utilities such as roads and water sources were mapped under this project. Despite the broader goal of the RUIS project to create reliable and comprehensive data for planning purposes, the document brings to light some of the inherent problems with state maps.
Accuracy and Reliability of data
Under the RUIS project, individual ward maps had been superimposed with land-use data collected by the RMC. The legend lists out the many land-use types digitised using the ArcGIS software - wasteland, open spaces, commercial plots, apartments, slums, urban villages and so on. These different categories of land-use mapped are demarcated on the map without any explanation of what some of these terms imply. Several areas were even categorised under the no data available section.
It did not take me too long to realise that there was no disclosure of the list of slums mapped, neither the status of these slums - notified or non-notified slum. At several places, there is a mention of the presence of unauthorised slums, but there was no explanation of which areas fall under the category of an unauthorised slum. Although the introductory part of the report clearly stated that the number of buildings and floors would be listed, only details of the total number of plots for a given land-use category was tabulated.
Maps are a powerful tool to visualise geographical information, thus, the use of scale, choice of colours and design are to be well thought of. As with any map, each ward map in the RUIS contains entities assigned a distinct colour. However, these colours lack clear differentiation and this could be very misleading. For instance, water bodies, commercial entities and non-commercial entities are all given similar shades of blue. Several large land parcels were marked in yellow and categorised as “Others”, for which the explanations are abstruse. While in some places it is mentioned as agricultural land, in others it is mentioned as both open space and agricultural land.
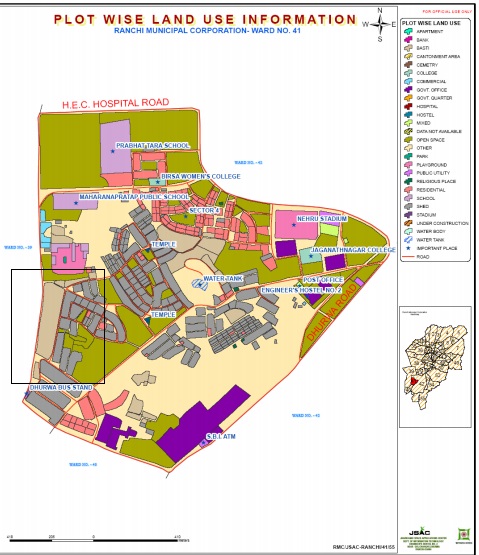
Image 1: Digitised map of ward 41
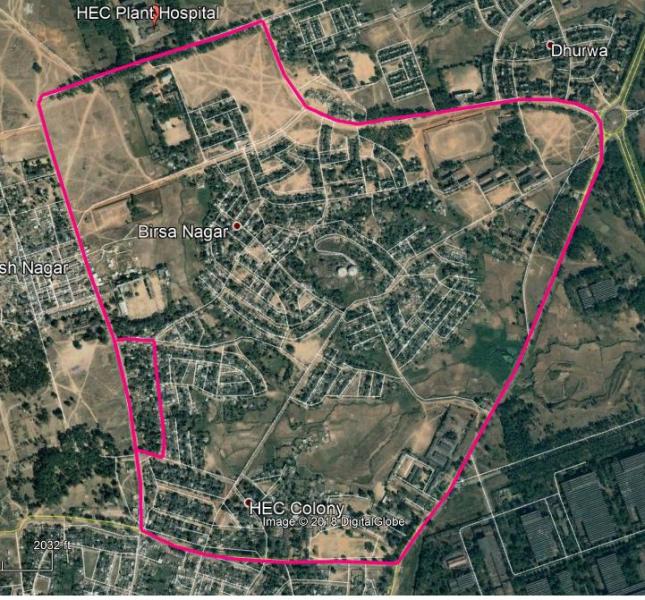
Image 2: Google satellite image of Ward 41 (2007)
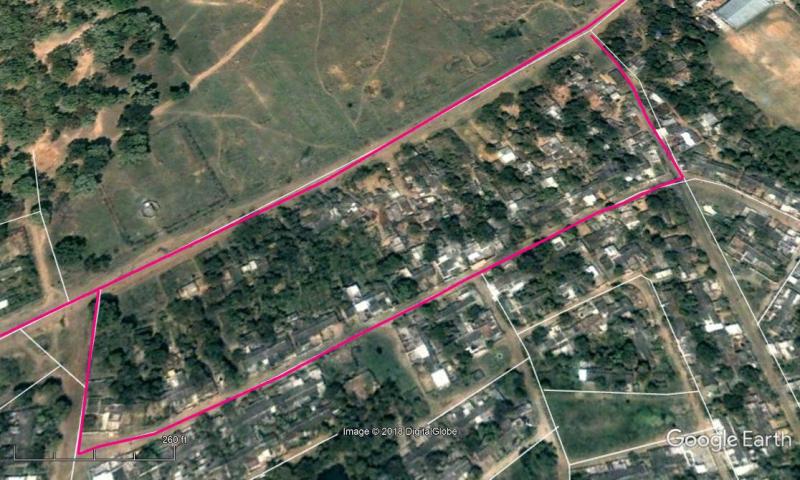
Image 3: A 2007 Google satellite image of one of the digitised slums in ward 41
Usability of Data
In a time and age where paper is almost obsolete, city maps are available only in paper due to the guidelines laid out under the New Map Policy, 2005 (NMP). On the pretext of national security and authenticity of these maps, access to GIS data is restricted. Hence, digitised maps available in PDF or JPEG format on public domain do not contain geographical annotations such as latitude, longitude or even scales. Owing to the absence of geodata, locating a place on these maps becomes immensely onerous. To derive more usable forms, these maps have to be re-digitised. For instance, I had to re-create the shapefile of the ward boundary by superimposing the image on to a satellite image using a GIS software. Only then was I able to study the physical features.
Furthermore, the New Map Policy (NMP,2005) restricts mapping of vulnerable places/areas. Irrespective of whether the area is restricted or not, publishing a map would require a clearance from the Ministry of Defence (MoD). Not only is the map-making process map laborious, but the prevalent ambiguity in what can or cannot be mapped adds subjectivity to a map’s content.
Municipal boundaries are important for administering critical services to people residing in different administrative blocks of the city. Services pertaining to water and sanitation are allocated using the existing ward boundaries, hence the recent swift shift in the ward boundaries have rendered all of these maps outdated and have also brought other mapping projects to a halt. This would also mean that the spatial inequalities in the distribution of public services cannot be adequately captured. All existing maps have become redundant at the expense of taxpayers money.
Map Literacy
While the RMC’s motives to inform citizens through maps is laudable, limited content is shared with the public causes great inconvenience to users. The restriction in content shared on a map brings about a recurring conflict between the national security and the right to information about the country. Moreover, the accompanying restrictions to access maps are harrowing.
To make maps more reliable and well grounded, there is an increasing need for citizens to participate in the mapping process to ensure greater detail. Maps can be often be viewed as a natural or transparent reflection of reality. However, there is a need for citizens to be conscious of the potential political message a map carries with it. Lack of awareness of the socially constructed nature of maps has heavy implications. While understanding information on a map is important, paying attention to why the map was made and who it was made by provides greater insight. Only by understanding the context of a map’s creation and utilisation can one have a clear picture of all the inherent messages in a map.
Add new comment