The WHO ‘Global Status Report on Road Safety 2015’ states that nearly 1.25 million people around the world die each year due to road traffic accidents.[1] Developing countries like India account for almost 90% of such accidents.[2] Recognizing that road traffic accidents are the leading cause of death in several countries, the Brasilia Declaration on Road Safety[3] was adopted to improve road safety legislations and policies.
In this context, it might be interesting to look at what the data tells us about the road accidents scenario in India given that the Ministry of Road Transport and Highways is preparing the Draft Road Transport and Safety Bill 2015. The National Crime Records Bureau (NCRB) compiles these statistics on an annual basis through the Accidental Deaths and Suicides of India (ADSI) report and has for the first time, in 2014, carved out a section in the report specific to traffic accidents. Although detailed data on accidents for the previous years are unavailable, it remains to be seen what insights can possibly be extracted with the available data.
NCRB releases all its data in PDF documents. The Traffic Accidents (including railway accidents) section under the ADSI 2014 report contains data relating to accidents and deaths split by state/UT and cities. Each table details accidents and deaths under a single category like time of accident, month of accident, place of occurrence, mode of transport, type of cause and so on. Only one table has data split by gender. Thanks to Tabula, an open-source PDF extraction tool, I saved countless hours from manually typing in data into Excel sheets. I digitised most of the available PDFs under Traffic Accidents for 2014 and a few of the ADSI reports of the previous years.
I chose to focus my analysis on the top severn cities in India by population, namely Delhi, Mumbai, Kolkata, Ahmedabad, Chennai, Hyderabad and Bangalore.
An overview of accidents across the years 2008-14
Figure 1
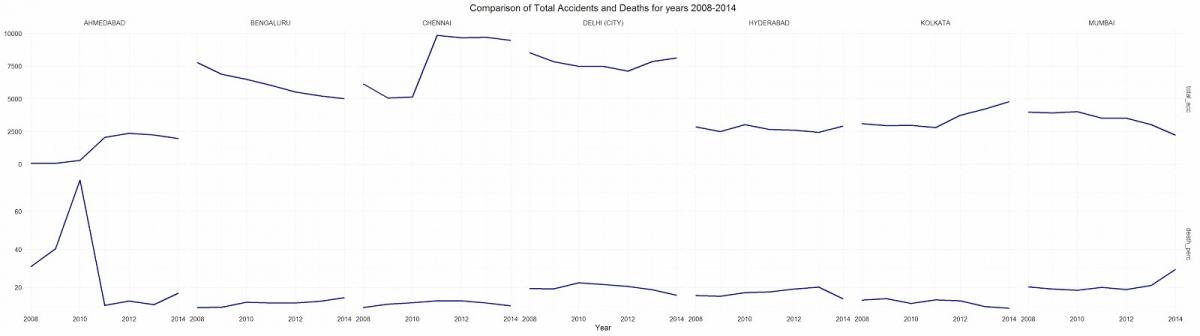
As Figure 1 indicates, Chennai, closely followed by Delhi and Bangalore, has the highest rate of accidents compared to all other cities. Although, Delhi and Mumbai seem to have death rates higher than other cities making the risk of death in an accident higher in those cities, the jump in accidents around 2011 in Chennai looks very interesting. An analysis of the source of these accidents, however, does not yield any insight. Mumbai and Bangalore see an overall decline in the number of accidents. There is also a sudden jump in Ahmedabad’s death rates in 2010.
Type of vehicle involved in an accident resulting in death
Figure 2
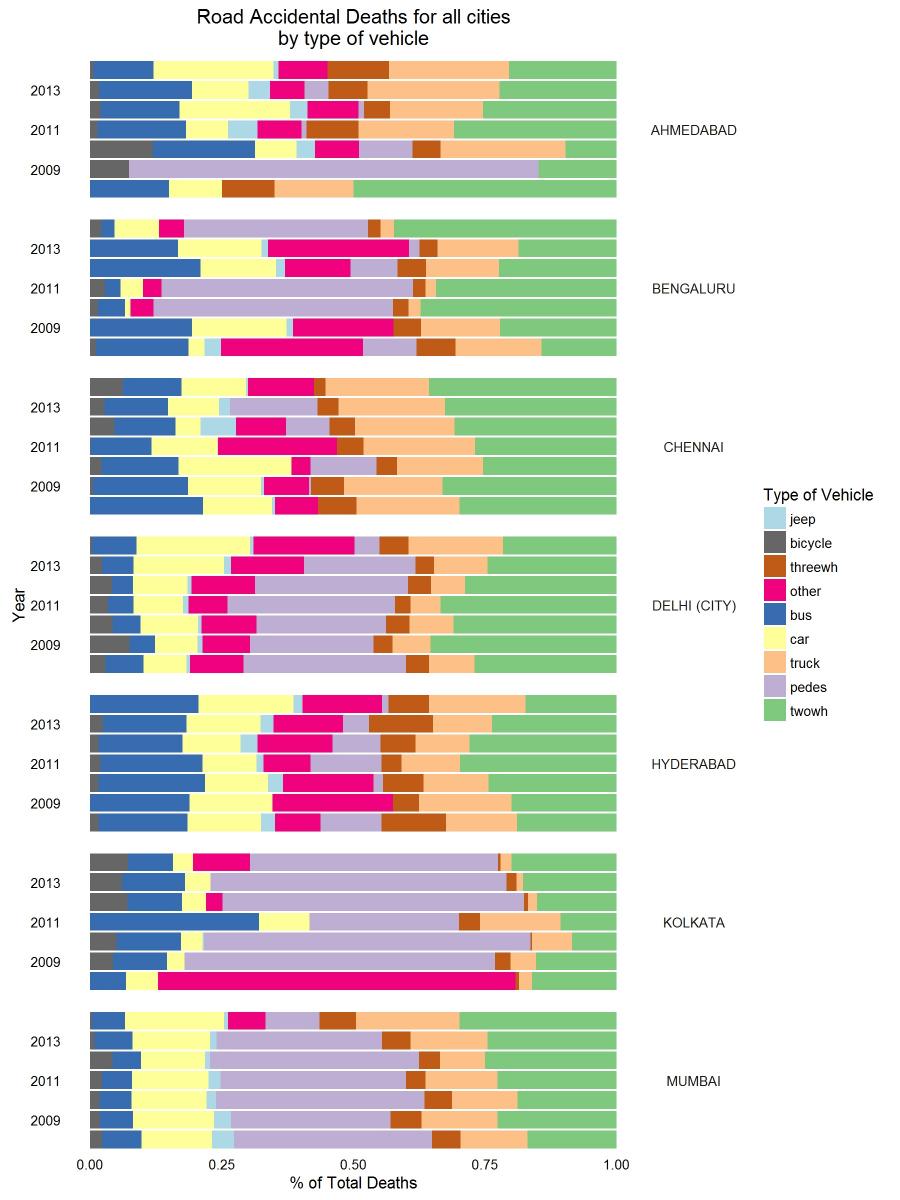
Figure 2 visualises the changes in proportion of type of the vehicle involved in road accidental deaths over the years 2008-14. The category that results in the most number of accidental deaths is ‘two wheelers’. Kolkata is the only aberrant here with most of the deaths involving pedestrians. The fact that Kolkata is deadly for pedestrians is reinforced by the fact that most of Kolkata’s accidents happen near pedestrian crossings. The patterns across the years are fairly stable except for Bangalore and Ahmedabad, where there seems to be erratic changes in proportions. Overall, two wheelers, followed by cars and buses are the top 3 vehicles involved in road accidental deaths. Other minor observations:
- Hyderabad has the highest proportion of accidents involving buses.
- Chennai has the highest proportion of accidents involving trucks.
- Mumbai and Delhi have a significant portion of their deaths involving cars.
Distribution of deaths by area type
Figure 3.1
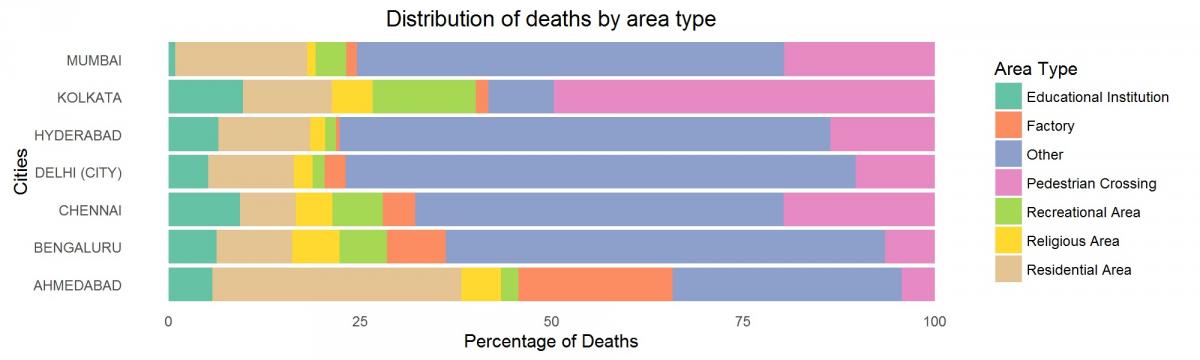
The next two figures explore the distribution of deaths by deaths by type of area, though it is unclear how an area is determined and there are overlaps in ‘area types’. For instance, there could be a pedestrian crossing in a residential or educational area. The “Other” category, a seemingly catch-all category, dominates here as it does in nearly all tables released by the NCRB. Kolkata has around 50% of its road accident deaths occurring on pedestrian crossings and, as mentioned earlier, pedestrian deaths form a significant portion of total deaths in Kolkata. The other areas where there is a considerable proportion of deaths are educational institutions and residential areas. Interestingly, Ahmedabad has a substantial portion of deaths occurring near factories and an even higher proportion occurring near residential areas.
Figure 3.2
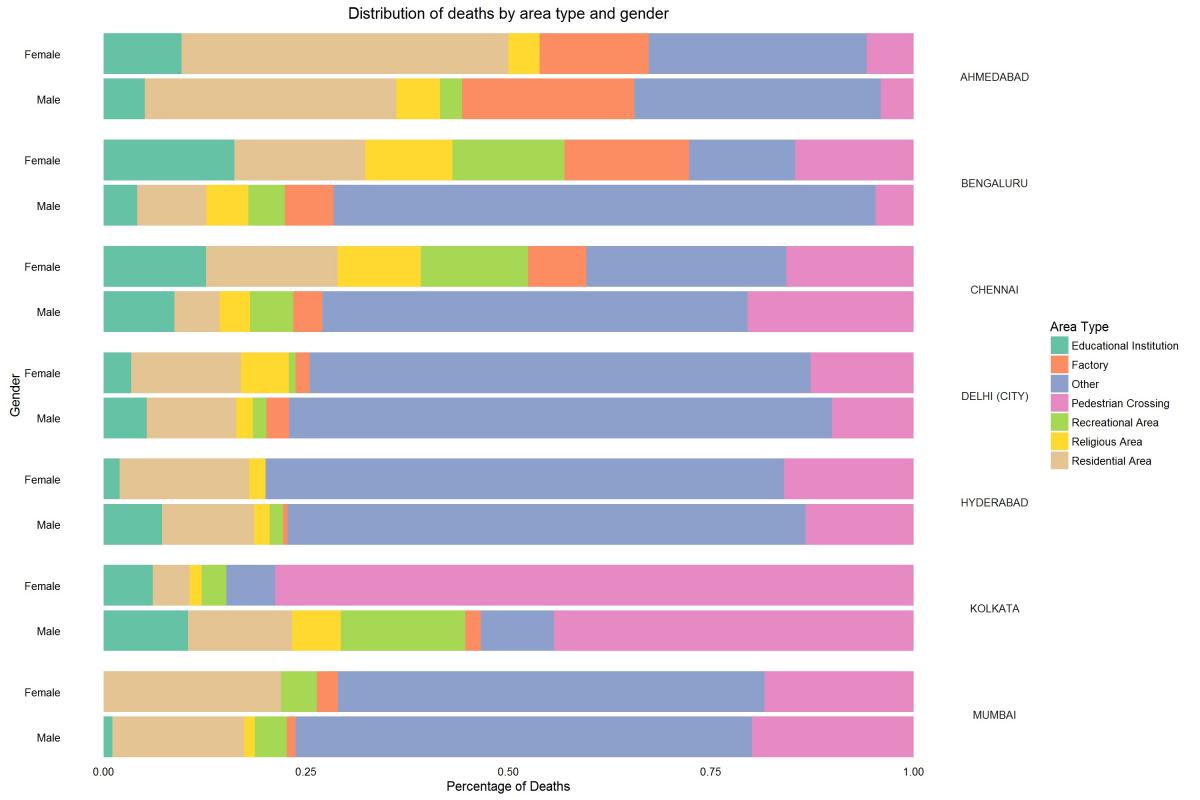
Figure 3.2 goes one level deeper by splitting the data by gender. From the chart, there seems to be an insignificant difference between female and male road accidental deaths in general except in Kolkata and Bangalore. More than 75% of female deaths in Kolkata are near pedestrian crossings. In Bangalore, female deaths are spread out among the various categories unlike male deaths, where there is a dominance of the ‘others’ category.
Distribution of deaths by cause
Figure 4
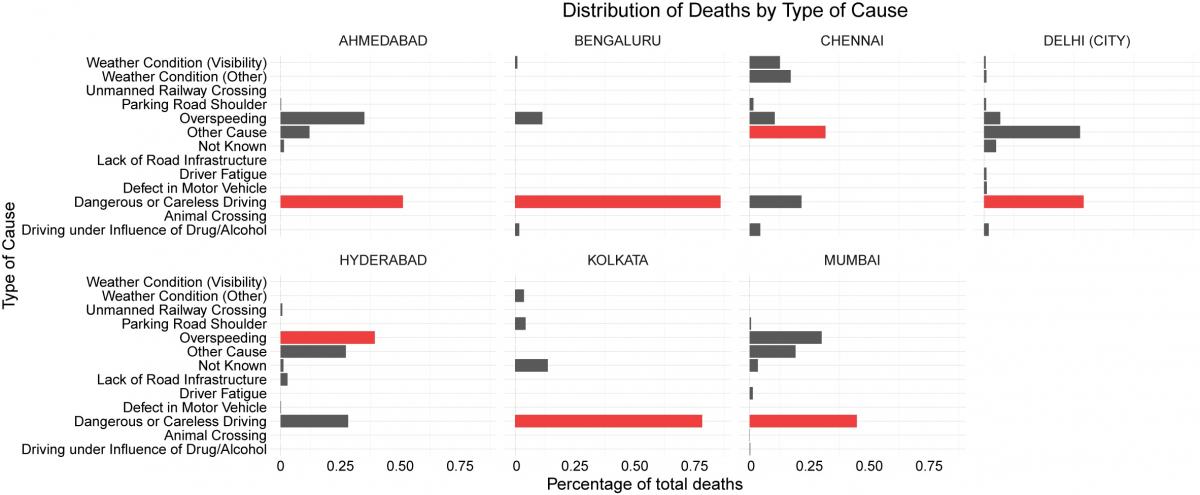
Figure 4 shows how dangerous and careless driving is the leading cause of death in all the cities except Hyderabad. The next most common cause is overspeeding. It is interesting to note that Chennai has a significant portion of deaths under the ‘weather condition’ category, though there is no clear explanation of what this might mean. The same category does not appear noteworthy in cities like Delhi, where one can assume that the winter fog might be a consequential factor in road accidents. Among the seven cities, Chennai has the highest number of accidents attributed to ‘driving under the influence of alcohol.
It is curious that there are a negligible number of accidents attributed to the ‘lack of road infrastructure’ for all the cities, raising questions about the definition as well as the understanding of those documenting accidents. The low drink driving numbers across the cities makes us suspect whether the police have the means to accurately establish blood alcohol levels at the site of an accident. The new Road Safety Bill contains a provision for scientific investigation of accidents - an urgent need now for without accurate data, we have no means of establishing what problem it is that we are trying to fix.
Key Takeaways and Conclusions
While the data provides an interesting overview of accidents in the top seven cities in India, the highly aggregated data limits the kinds of insights we can draw. A more granular form would allow us to study interrelationships between factors, such as between the time of an accident and the place of occurrence.
The lack of metadata further limits meaningful analysis. For instance, despite the “other” category having high proportions, there are no explanations about what types of accidents qualify here. This is a flaw of the pro forma NCRB provides to the State Crime Record Bureaus to collate data. We do not specifically know what and who determines whether a person is an offender or victim, how areas are classified, or who determines the correct cause of accident. The National Data Sharing and Accessibility Policy-2012 by the Ministry of Science and Technology recognises the need for metadata but does not explicitly mention the need for data dictionaries[4] which open data policies in the US[5] and UK[6] do.
Another important hindrance to the data analysis is that the data is provided in PDF tables rather than machine-readable and open-source formats such as CSV, JSON and XML. Significant time is spent on extracting data from such tables even with good extraction tools.
Nevertheless, the ADSI reports from the NCRB provide an interesting snapshot of road accidents in India.
[1] World Health Organization, “Global status report on road safety 2015”, http://www.who.int/violence_injury_prevention/road_safety_status/2015/en/
[2] World Health Organization, foreword to “Global status report on road safety 2015”, vii. http://apps.who.int/iris/bitstream/10665/189242/1/9789241565066_eng.pdf
[3] “WHO | Brasilia Declaration on Road Safety”, World Health Organization http://www.who.int/violence_injury_prevention/road_traffic/Brasilia_Declaration/en/
[4] Ministry of Science and Technology, “National Data Sharing and Accessibility Policy - 2012” http://ogpl.gov.in/NDSAP/NDSAP-30Jan2012.pdf
[5] White House, “Open Data Policy” https://www.whitehouse.gov/sites/default/files/omb/memoranda/2013/m-13-13.pdf
[6] https://data.gov.uk/sites/default/files/Open_data_White_Paper.pdf
Add new comment