On June 4, The Initiative on Waste, Informal Workers, and the Future of Chennai, a coalition of research and advocacy groups currently led by Citizen consumer and civic Action Group (CAG), undertook a waste assessment and characterisation study (WACS) on Marina Beach, Chennai. Volunteers from the Angels of the Marina and Just Volunteer groups collected 40 bags of inorganic waste from a 200 metre stretch of the beach in two hours. Over the course of the rest of the day, five informal waste workers and six researchers segregated each piece of waste into 15 product and use categories:
- plastic bags and covers (packets containing food like sambar, ketchup)
- plastic wrappers (ice creams, chips, biscuits, cigarette boxes, toothpaste tubes)
- plastic cups (for water, tea, packaged beverages)
- plastic water packets
- plastic water bottles
- plastic cutlery (spoons, forks, straws, bottle caps, combs, toothbrushes)
- nylon ropes, nets
- thermocol or styrofoam (plates, cups and packing material)
- paper (cups, plates, newspaper, cardboard)
- juice cartons
- glass (alcohol bottles)
- metal (aluminium food containers, beverage cans, deodorants, party poopers)
- rubber and leather (shoes, slippers, balloons)
- medical (bottles, inhaler, pregnancy test)
- e-waste (batteries)
- miscellaneous (cloth, rexine)
The researchers then counted each piece of the segregated waste and found a total of 9170 pieces of inorganic waste, of which 95% was plastic. There are seven categories for this type of waste (Table 1). Plastics were further divided into Polyethylene Terephthalate (PET); Polyethylene (HDPE); Low Densitity Polyethylene (LDPE); Polypropolene (PP); Polysterene (thermocol/ styrofoam); and Nylon. The category of paper comprised of paper and cardboard, and Tetrapak is a separate category.
Table 1: Quantity of waste by waste category
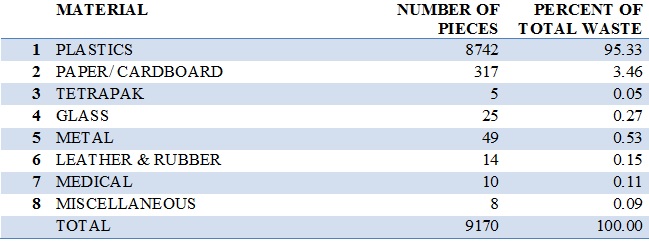
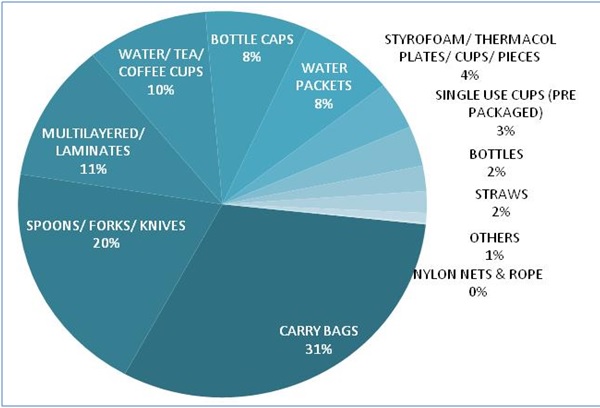
The WACS at Marina Beach revealed that the bulk of the waste found on the beach was of low quality plastics. Carry bags and plastic sheets, or polyethylene, are the largest quantity of plastics we found. Fresh food and drinks such as tea and coffee, idli/dosa/sambar/chutney, bhajjis/ samosas, etc are either served in it or in plates lined with these plastic sheets. However, these are low quality plastic and have little or no value in the recycling. The second largest quantity of plastic waste is spoons, forks and knives. Together with straws, they account for a little over 20 percent of the plastic waste.
Multilayered packaging is the third largest contributor to plastic waste on the beach. These are also ubiquitous in their presence in marketed products, such as ice creams, chips, biscuits and chocolates. ML packaging typically has at least one layer of plastic, thin aluminium foil and sometimes paper, and is preferred by manufacturers because it is light, takes less space to store and is graphics friendly. Unfortunately, these are for use and throw, are not reusable, and are recyclable at a huge economic and environmental cost. It is these materials that clog the drains and remain in the soil and waterways.
Figure 1: Quantity of plastic waste by product type
Most of the plastic packets cannot be recognised, but many of the products are established brands, manufactured by large corporations, such as Hindustan Lever, ITC, PepsiCo, Coca Cola, Parle and Hatsun. Qwality Walls ice cream, manufactured by Hindustan Level Limited, accounts for 49% of the total laminates we found. This was followed by wrappers of Arun Ice Cream, which accounted for 10%. ITC accounted for 6.5% of the ML packaging, through wrappers of Sunfeast biscuits, Bingo chips, and Gold Flake, Wills and other cigarette boxes. Britannia product wrappers were 5.6%, while PepsiCo’s brands of Lays chips and Kurkure accounted for 5%. There are several local brands, including Saravana Bhavan, Adyar Anand Bhavan, Shakti Masala and Aachi Masala, which account for 6% of the ML packaging.
Plastic cups used for water, tea and coffee formed a little under 10% of the total plastic waste, water packets were 7.6%, and single use plastic cups with pre-packaged drinks accounted for another 3.36%. Packaged water bottles amounted to 2%, with Coca Cola and Pepsi Co accounting for 16% and 12% of the bottles, respectively. Bottle caps, are another significant challenge for waste collection and recycling, were 8% of the plastic waste, and Coca Cola, Bovonto and Pepsi Co were the three most recognisable brands.
The SWM Rules 2016 mention that it is important to have a waste hierarchy in managing waste by prevention, reduction, reuse, recycle, recovery and disposal at landfills, with prevention being the most preferred option. It is the responsibility of local bodies in towns and urban agglomerations to implement separation of waste at source, decentralised composting of organic waste, door-to-door collection of waste, and direct that no waste is to be disposed in open public spaces, streets and drains. It also directs local bodies to set up waste deposition and storage sites, material recovery parks, disposal facilities for hazardous materials, and to enable easy access to waste pickers to collect recyclable materials. While all of this would divert waste from landfills, it does not adequately address the problem of prevention and reduction of waste.
More specifically, the Plastic Waste Management Rules 2016 state that it is the responsibility of producers, importers and brand owners to “work out modalities for waste collection system based on Extended Producers Responsibility and involving State Urban Development Departments, either individually or collectively, through their own distribution channel or through the local body concerned.
Single use, low quality plastic – used in carry bags, multi layered packaging, single use cupts and cutlery - is extremely hard to collect and segregate. Even if collected and segregated, they would end up on our beaches and streets because there is no market or processing facility to recycle. In the absence of a viable market to collect and process these materials, the main alternative for their disposal is landfills. Therefore, there is a strong case to be made for banning the production of such materials. At the very least, we must apply the polluter pays principle on the plastic waste and impose EPR rules for their collection and sustainable disposal.
Add new comment