Introduction
Solar energy is a clean source of energy and there is an increasing interest worldwide for its sustainability. It is one of the most widespread technologies which ensures low environmental impacts. A grid-interactive system, commonly known as an On-grid system consists of solar photovoltaic (PV) panels, distribution boxes, Inverter and load whereas an off-grid system comprises a battery in addition to these components.
A solar photovoltaic panel consists of solar cells which convert solar radiation into electricity. These panels are mounted on the roof and tilted at a certain angle, based on the geographical location of the premises, to capture maximum solar radiation from the sunlight to attain maximum output from the panels. To achieve maximum output, solar panels have to be cleaned at regular intervals. But, there are chances for accumulation of dust particles on the panels and sometimes bird droppings also might be there. These particles obstruct the solar radiation reaching the solar cells and reduce its performance thereby reducing the output power.
Studies have proved that the accumulation of dust on solar panels has an impact on performance.
A study which aims to find the influence of dirt accumulation on the performance of PV panels has conducted an experiment to find out the performance drop in the output of the solar panel. They used a 50 W solar panel and evenly spread particles such as talcum, dust, and sand on the panel. The maximum output power of panels laden with these particles reduced in comparison to a clean solar panel for talcum - 31%, dust - 73%, sand - 80%. In addition to this, they found moss, which could reduce the output power by up to 86%
Another study was conducted in which indoor and outdoor experiments were carried out to find significant effects of dust in the output of the solar panel. They used a 37 W solar panel for the experiment. In both cases, they concluded that associated power loss was 45-55% of the maximum possible power output from a clean panel.
Citizen consumer and civic Action Group (CAG) attempts to study how solar panel performance changed in various seasons and dust accumulated on the solar panel over a period of time. A 4 kW rooftop solar rooftop solar installed in the CAG premises has been taken for the study.
Overview of usage
CAG has installed a 4 kW rooftop solar PV system with a bi-directional meter in the month of November 2018. Since CAG’s rooftop was sloped and also needed to access the other side of the roof, the team installed thirteen 320 watts solar panels in an elevated mounting structure. The below image shows the rooftop solar installed at CAG.
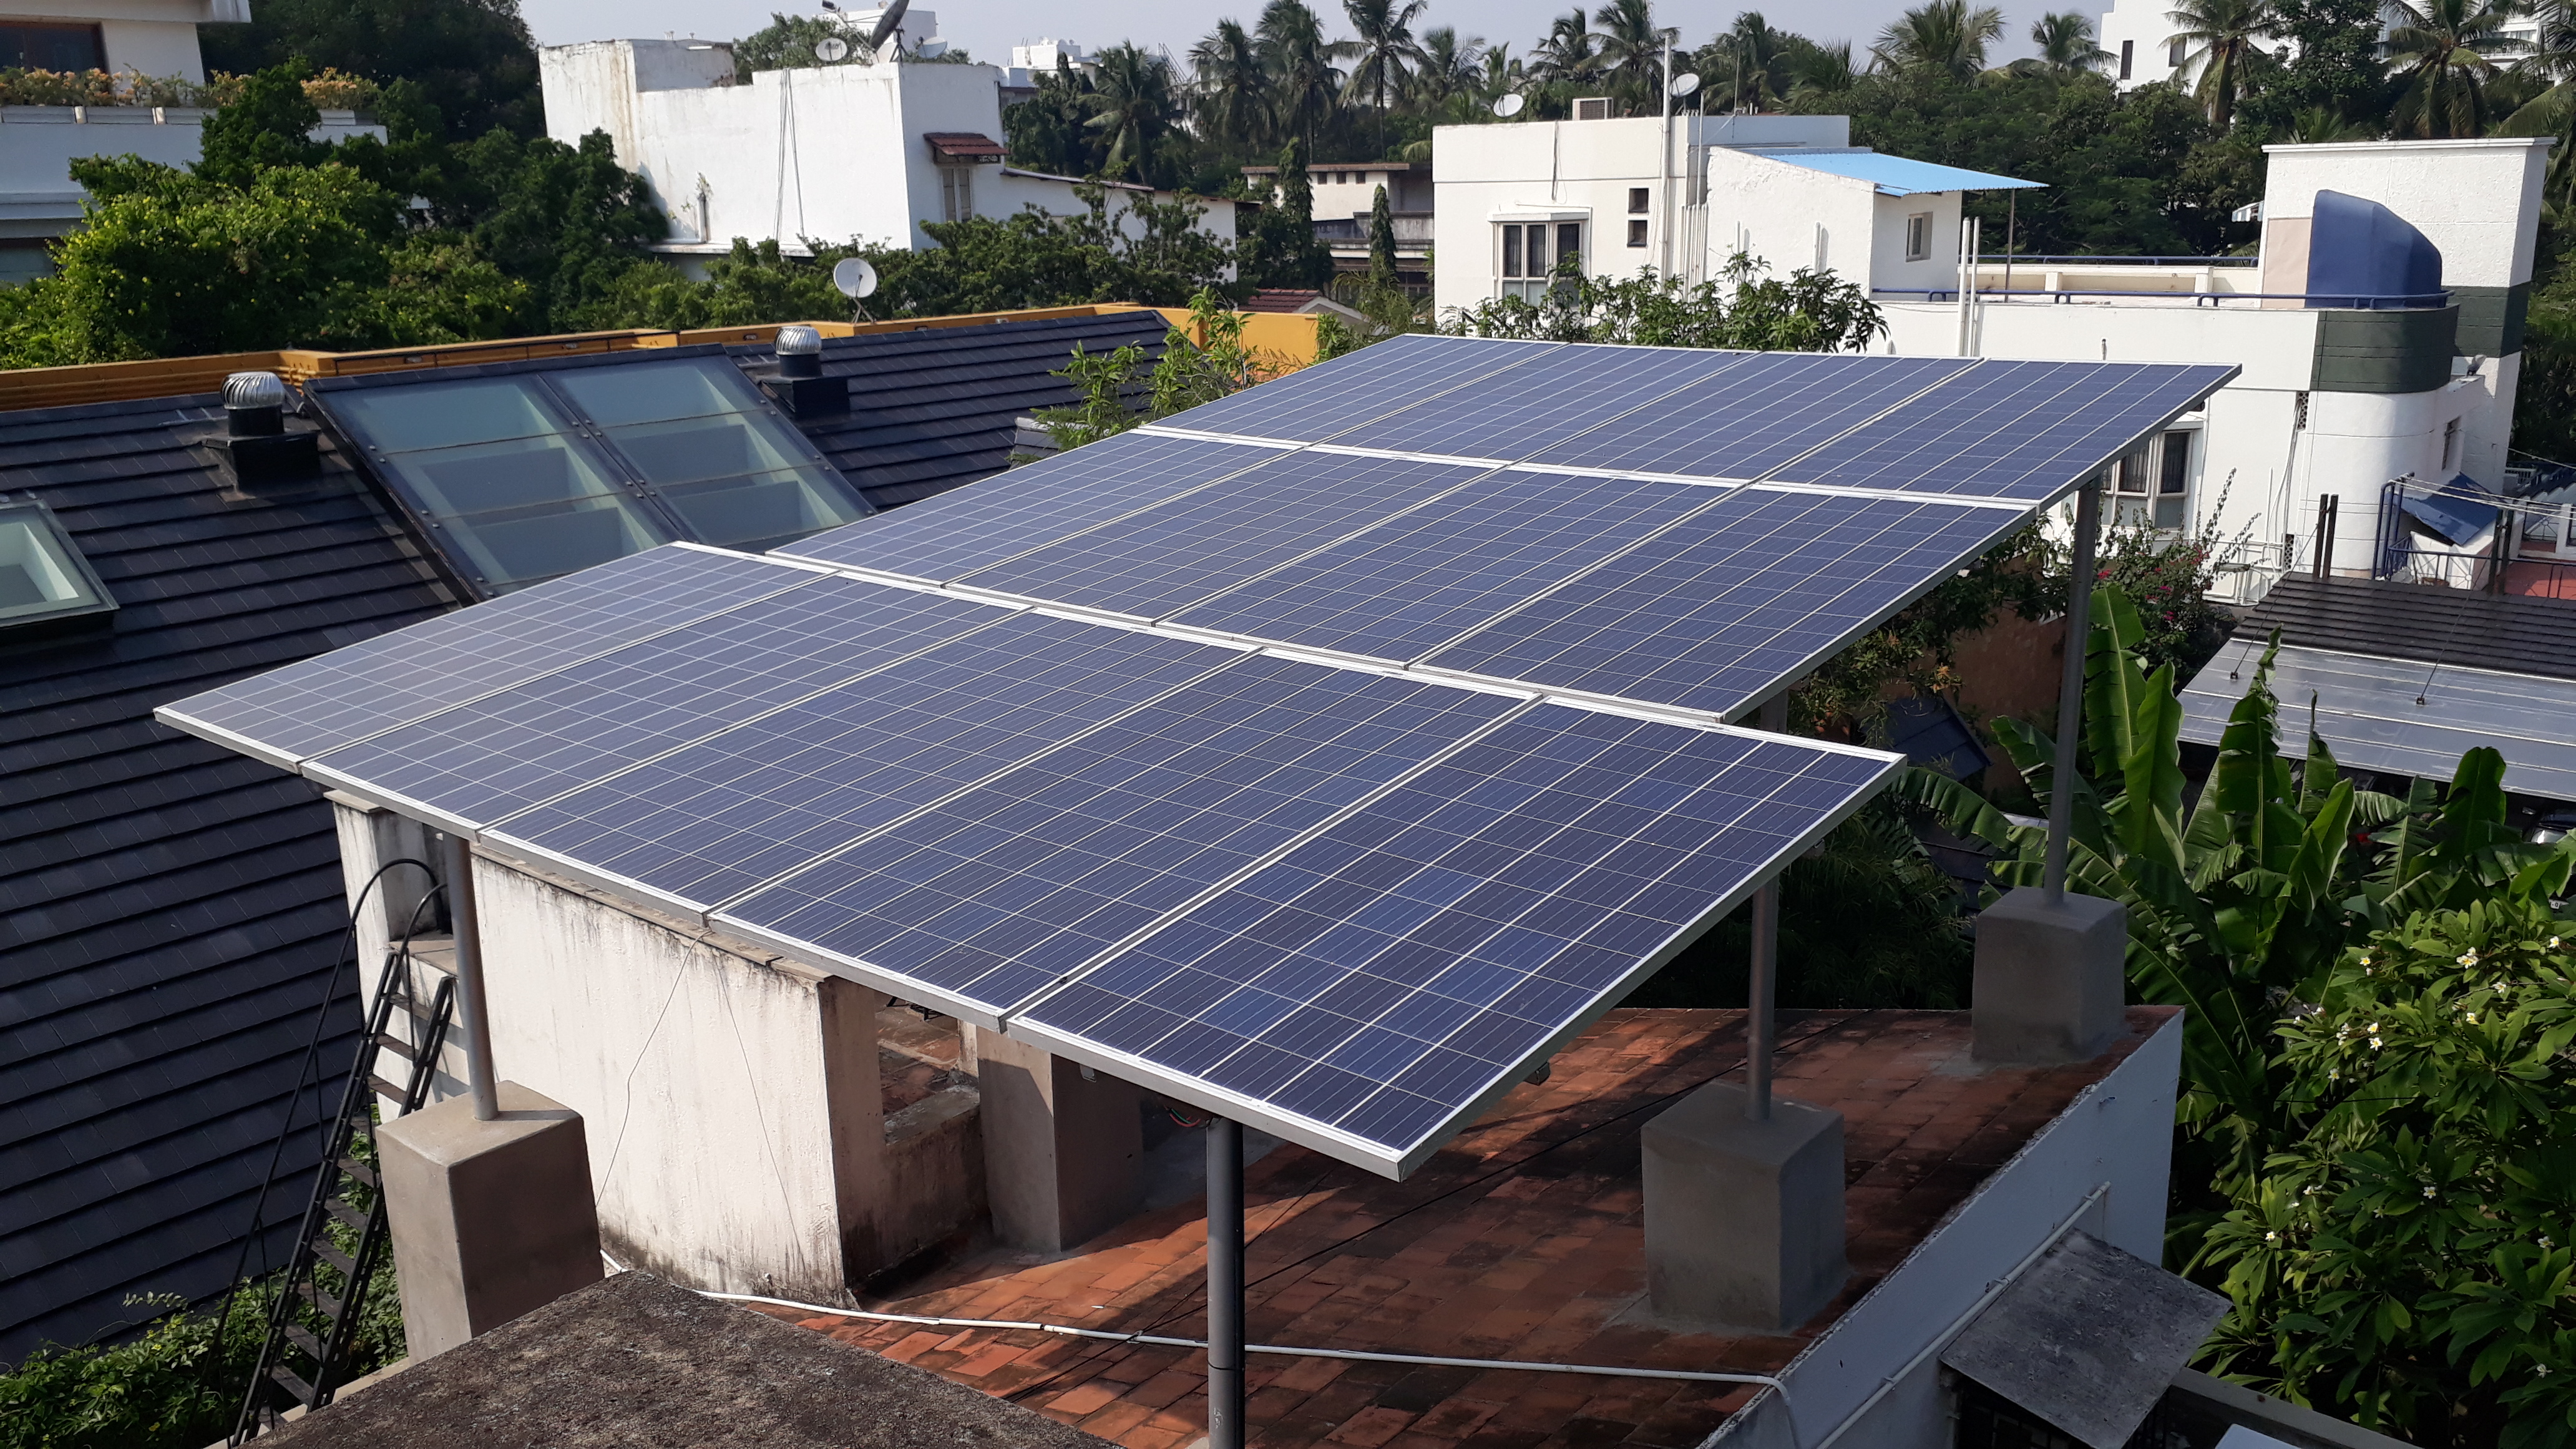
Image 1: Rooftop solar installed at Citizen consumer and civic Action Group
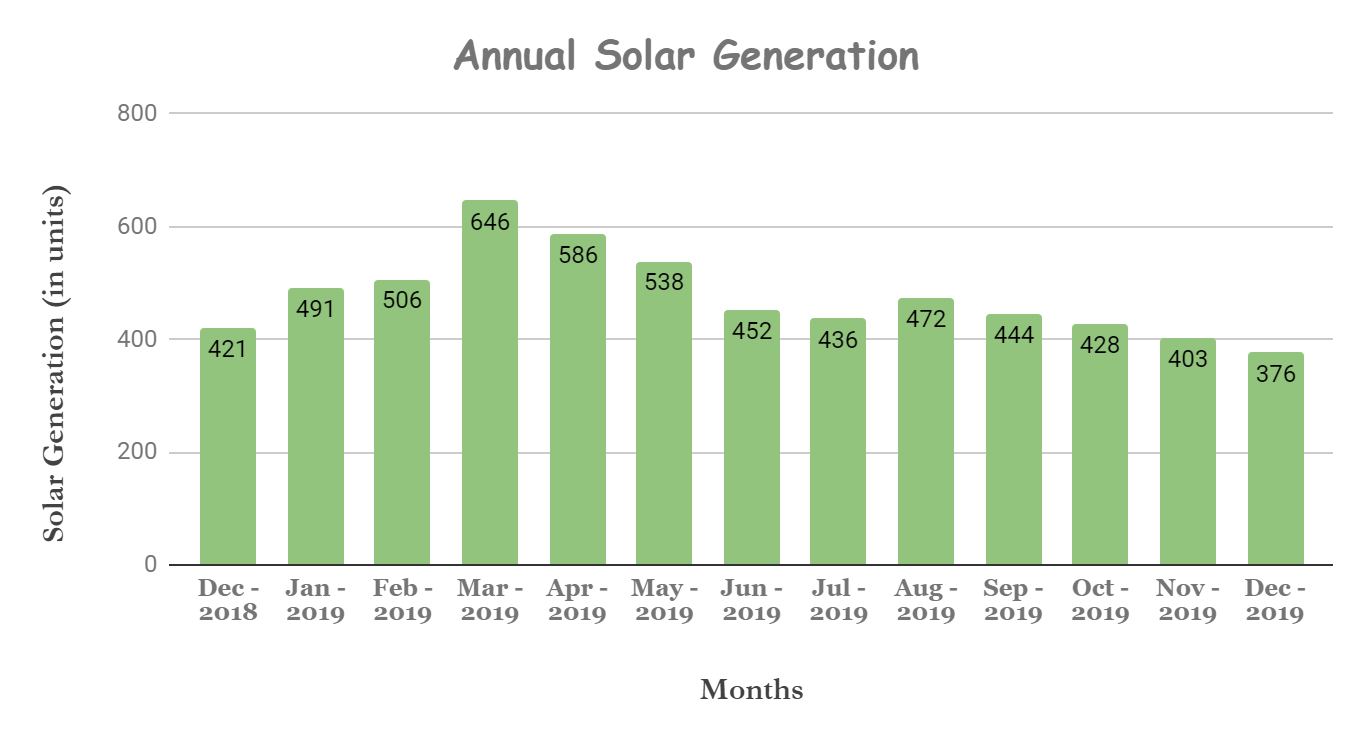
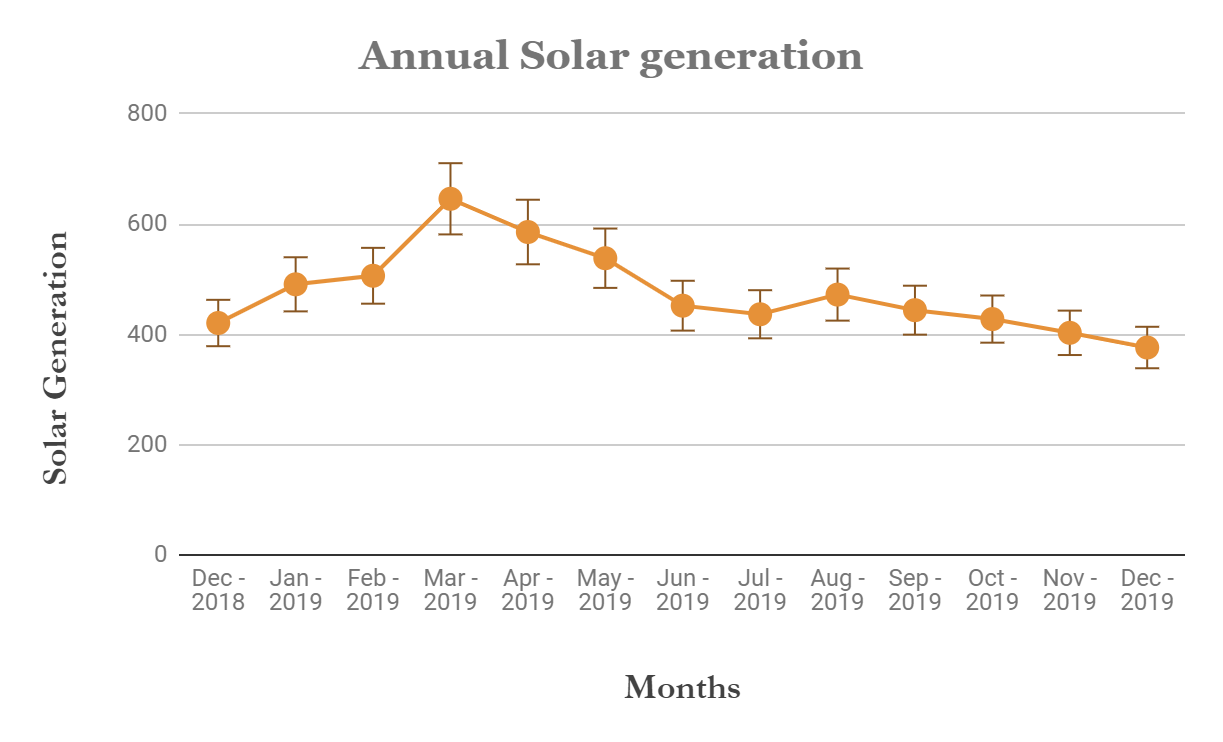
Before rooftop solar installation, CAG’s required annual energy consumption was 5,600 units and by adding some of the loads the annual consumption (December 2018 to November 2019) was around 6,458 units. The below graph explains the number of units generated by solar PV over a period of one year.
Of the total solar power generated in this period (5,822 units), 1,914 units have been consumed for direct use and 3,908 units have been exported to the grid. The reasons for more export than import was a) load was not equally distributed among the three phases and b) this is an office premise with the work time of 08:30 to 18:30 hours, with Saturday and Sunday as holidays. The below chart will explain the amount of solar generation, self-consumption, import and export.
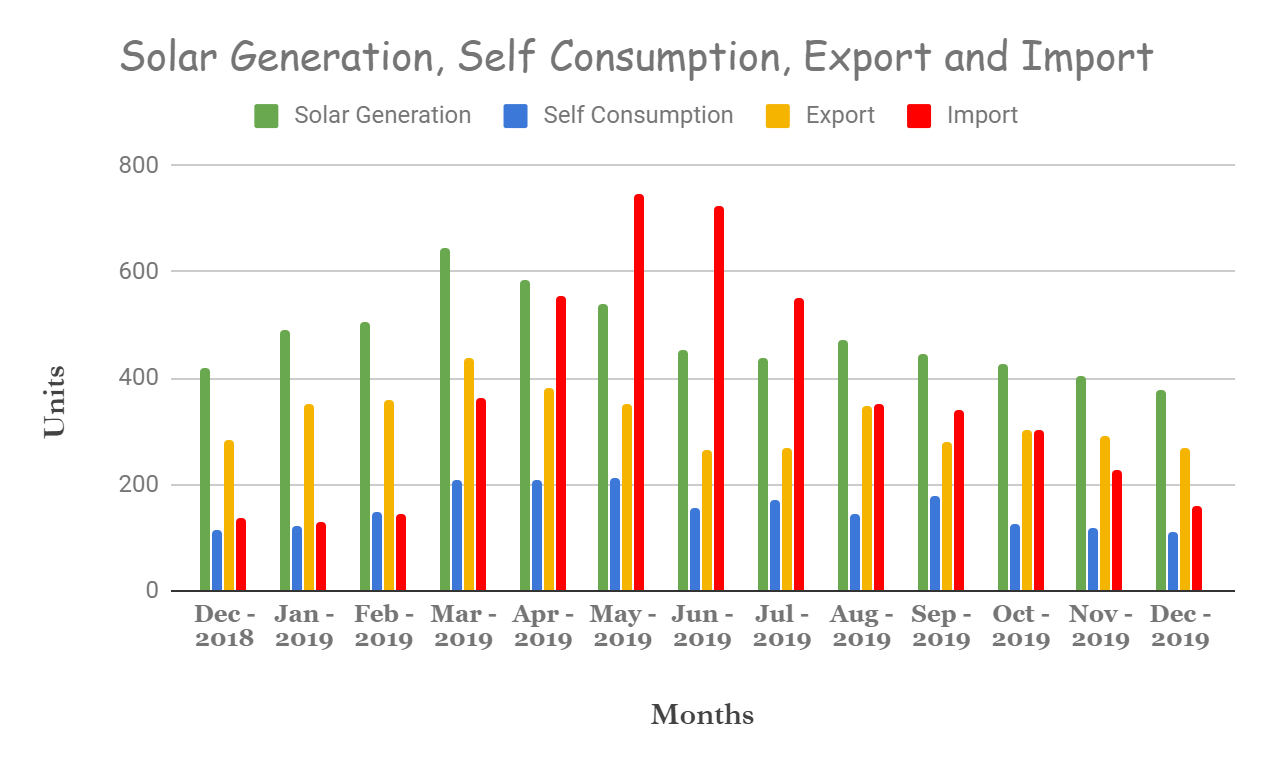
From the above graph, it is evident that the rooftop solar generated more energy during the months between Jan to May and imported more energy from the grid during the months between April to July since the usage of air conditioners was high during those periods.
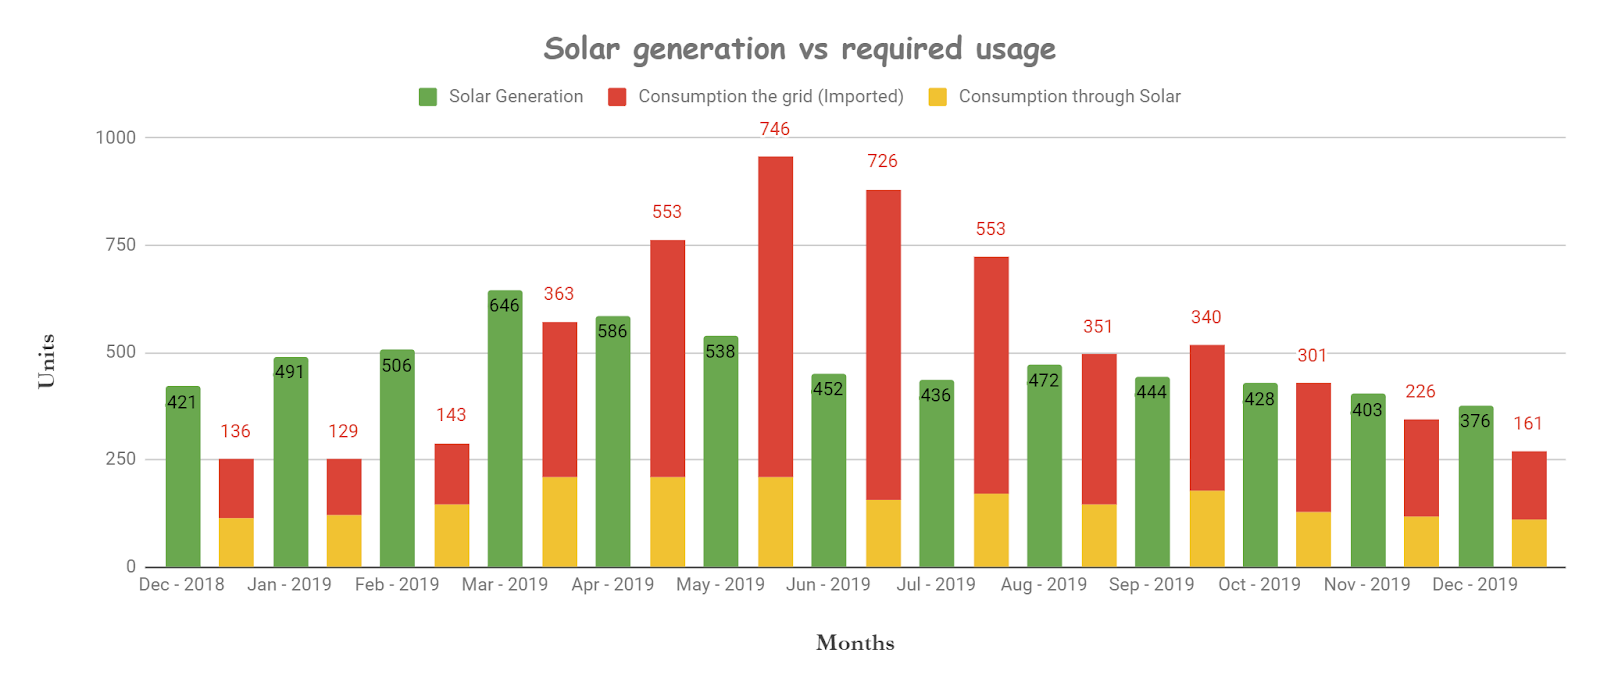
The below graph will explain the amount of energy that was required and how much is contributed through rooftop solar. The total consumption is the sum of energy imported from the grid and self-consumption through solar.
During the month of December 2018 to February 2019, the usage of electrical appliances was less and 70% of the energy generated through solar was exported to the grid. The total energy consumed during the month of March to June was 3,171 units and 75% of the energy was consumed from the grid.
Note - The solar generation data was collected with the help of the inverter on a daily basis but the export and import data were manually collected through the readings taken on every working day around 10.00 am.
 Dust and its impact
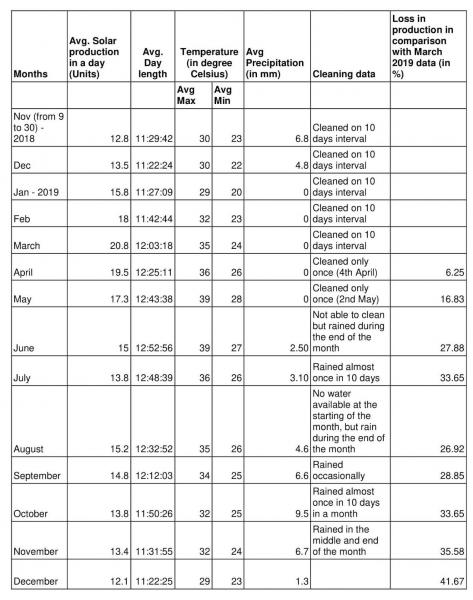
Generally, a 1 kW rooftop solar generates an average of 1,500 units per year. In CAG premise, 4 kW rooftop solar generates 5778 units during the period of Jan 2019 to Dec 2019.
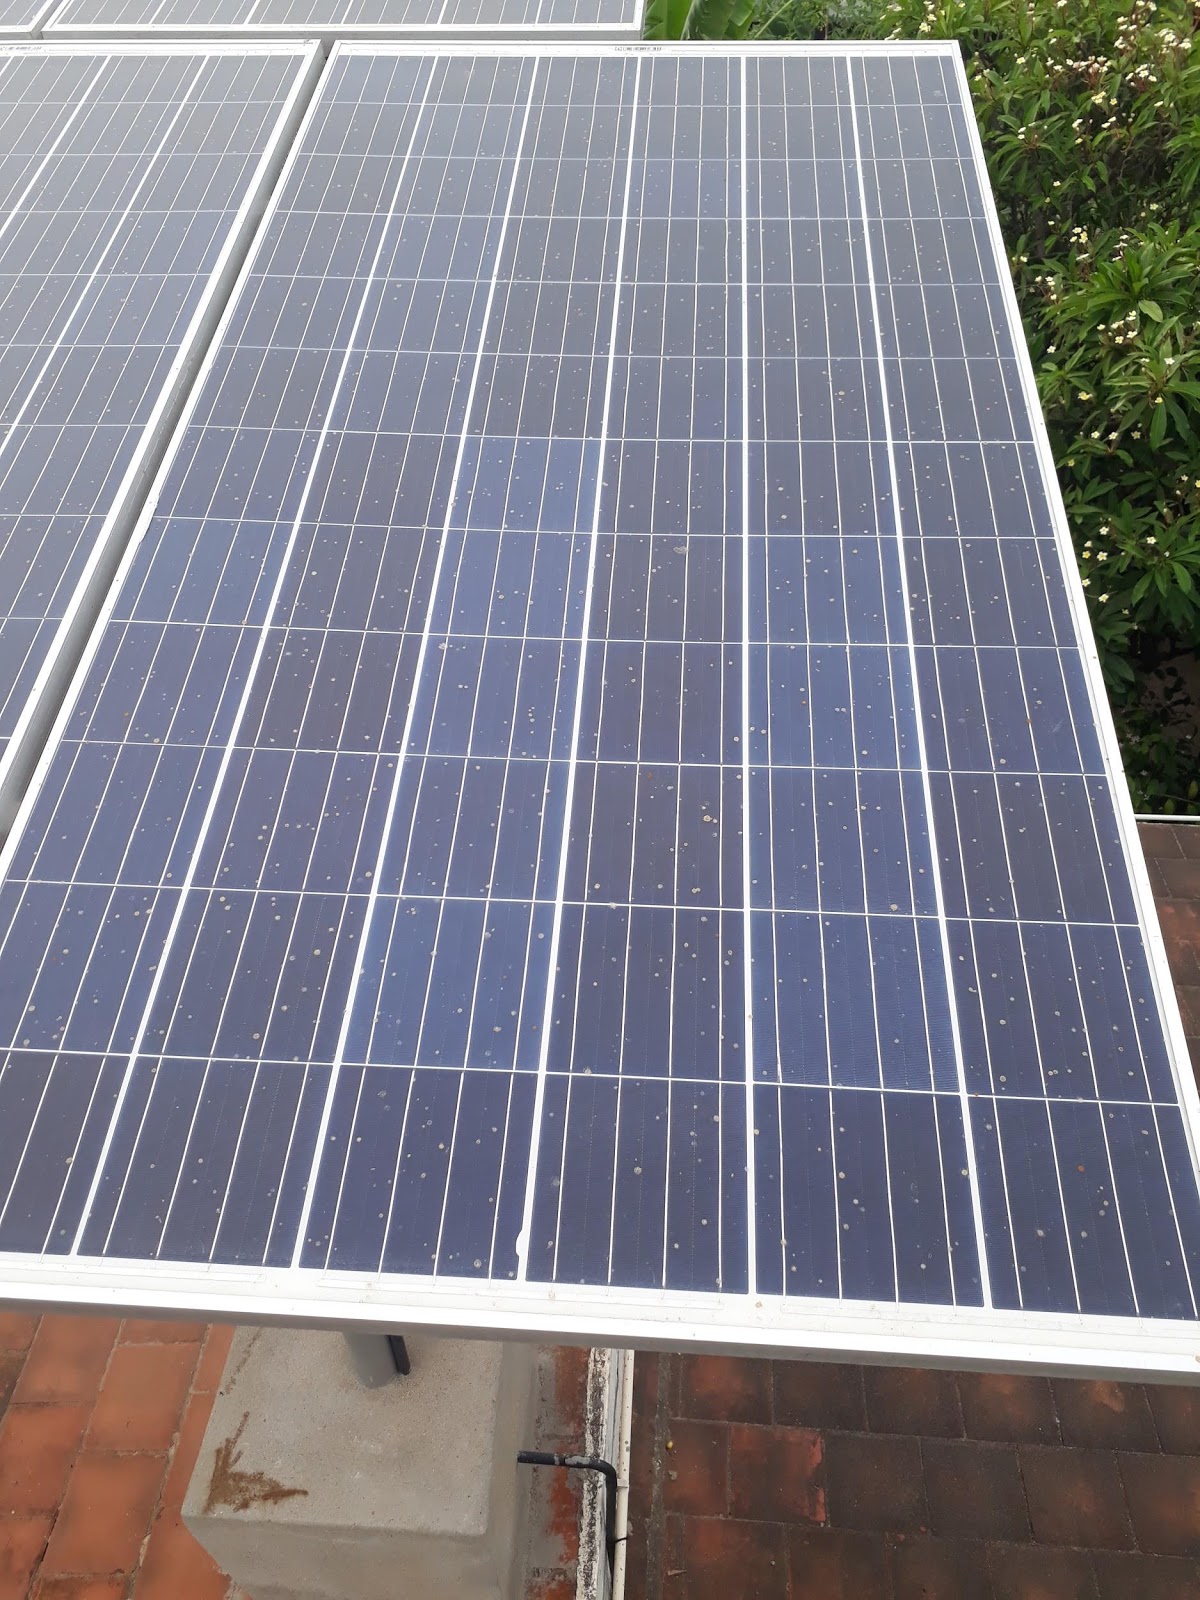
From the above chart, it is evident that the solar generation decreases after March. Comparing the June and July month generation with Jan and Feb, the latter had more production. This is because of the accumulation of dust and temperature. During those months, there was a water crisis in Chennai and CAG had to depend only on rain for cleaning. The below image represents the status of the panel when it was not cleaned for 45 days.
The generation improved in the subsequent months (August and September) as there was rain at regular intervals and it washed away the dust accumulated on the panels. As the rainy season ended in the month of November and December, the generation level reduced as there was no chance for cleaning.
Conclusion
The above examples demonstrate that dust accumulation on the solar panels tremendously affects the performance of solar PV and the output power could reduce by 41%. To overcome this issue, proper cleaning of solar panels is necessary. It is advisable to clean solar panels at least twice in a month in order to get maximum output from the system.
Add new comment